
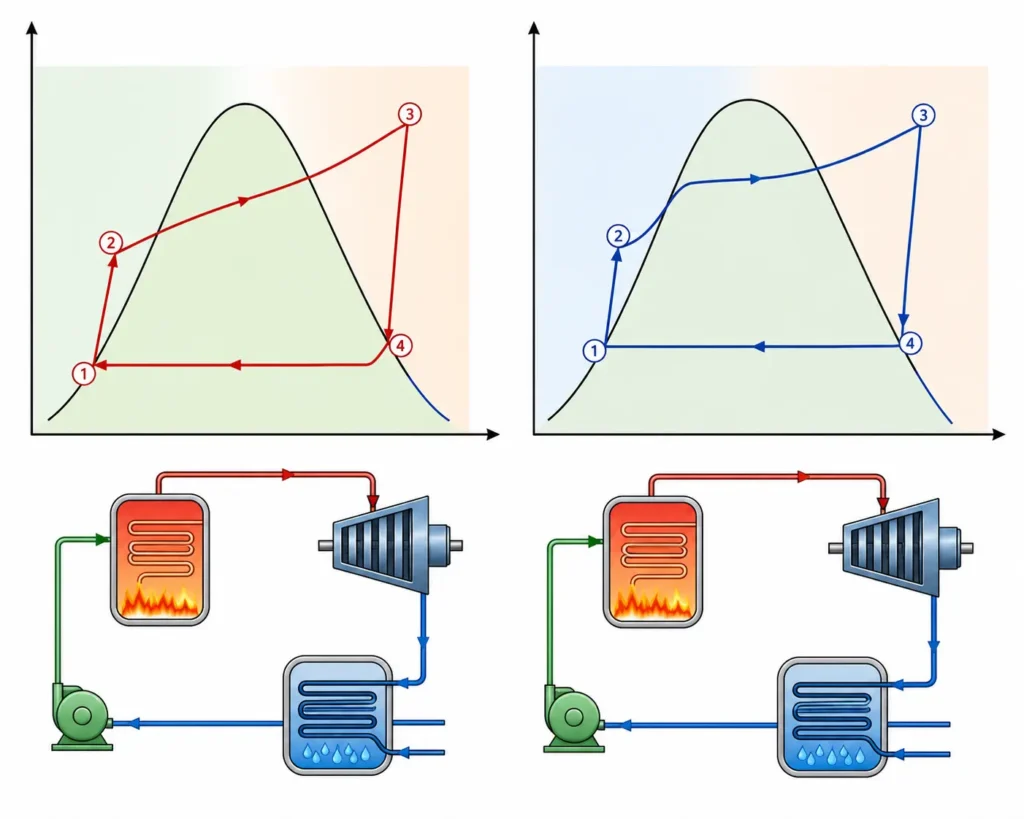
T-s diagram and h-s diagram are very essential tools in the thermal system as they provide the graphical representation of the thermodynamic processes and helps evaluating the performance of the thermodynamic cycles. T-s and h-s diagram help engineers to visualize heat transfer, work output, change in entropy and state properties during the cycle. T-s and h-s diagram are extensively used to analyse the Rankine cycle, reheat Rankine cycle, regenerative Rankine cycle and combined cycle power plants.
Table of Contents
T-s Diagram
The Temperature-Entropy diagram or the T-s diagram is a graphical representation of the thermodynamic processes in which temperature T is plotted on the vertical axis and entropy s on the horizontal axis. It helps to analyse the steam and gas power cycle because it clearly illustrates the heat transfer and process direction.
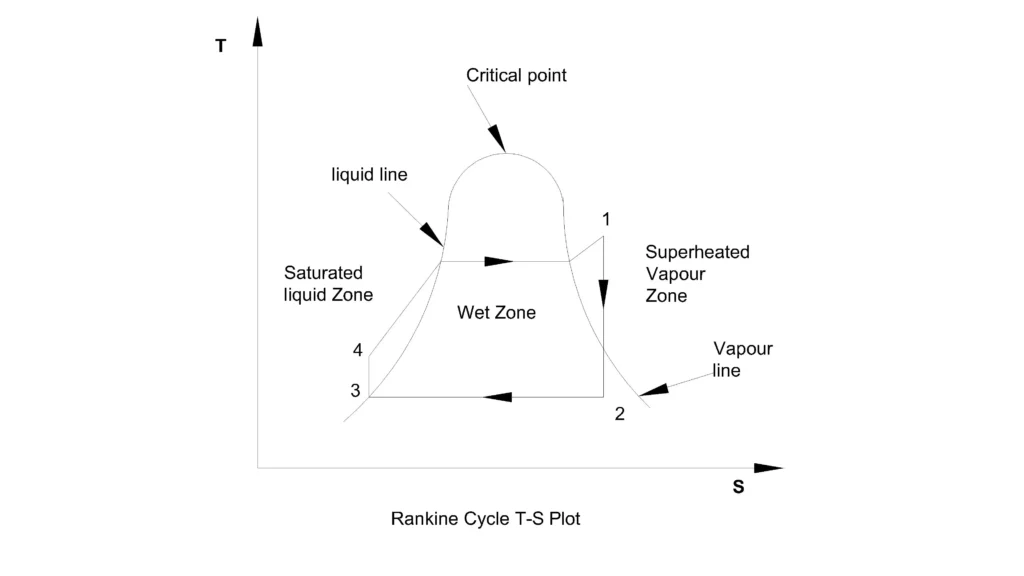
At the center of the diagram, there is a saturation dome, which is formed by saturated liquid line on the left and saturated vapour line on the right. At the top, where the liquid line and vapour line meets, is the critical point. The saturation dome divides the thermodynamic states into three region which are:
- Compressed liquid zone: on the left of the dome (left of saturated liquid line).
- Wet or Two-phase zone: Inside the dome.
- Superheated vapour zone: on the right of the dome (right to saturated vapour line).
The critical point on the top of the dome is a unique temperature and pressure point where the liquid and vapour merges into one or becomes indistinguishable. At this point the boundary between liquid and vapour vanishes as surface tension becomes zero. Also the latent heat of vaporisation becomes zero.
For a reversible process, the area under the process curve represents the heat transferred.
For irreversible process, the area under the curve is always greater than the actual heat transfer. This is because part of entropy increase comes from the entropy generation rather than heat addition.
Therefore, in real boilers and condensers, the heat transfer is irreversible because of the finite temperature difference and so the exact heat transfer is determined from the change in enthalpy (Q = Δh). But as the steam passes through quasi equilibrium states and the irreversibilities are relatively small, the T-s diagram remains an excellent tool for visualizing the heat addition or rejection and approximating it.
However, the T-s diagram still holds good as it clearly shows
- superheating,
- reheating,
- regeneration,
- moisture content,
- entropy increase.
How to read the t-s diagram
The t-s diagram provides a clear visualization of heat addition, heat rejection, work output. Each process has a distinct shape that helps engineers to understand the performance of the cycle.
Pump process
The pump compresses the saturated liquid from the condenser pressure to the boiler pressure. As the water is incompressible, the process appears nearly vertically upward line with slight increase in entropy and temperature.
Boiler process
Here, heat is added at constant pressure in three stages. Firstly the temperature of the feed water rises. The water then changes to saturated steam at constant temperature and pressure. The steam is then superheated and temperature rises beyond the saturated vapour line.
Turbine expansion
The superheated steam expands in the turbine producing shaft work. The expansion is isentropic for an ideal turbine and appears as nearly vertical downwards line with constant entropy. For actual process, the line will shift slightly towards the right.
Condensation
The exhaust steam enters the condenser, where heat is rejected at constant pressure and steam condenses to saturated liquid moving from right to left beneath the saturation dome.
The area enclosed by the cycle on the t-s diagram represents the net work output of the cycle.
h-s Diagram
The Enthalpy-Entropy diagram or h-s diagram, commonly known as Mollier chart, is a graphical representation of the thermodynamic properties of steam. In the Mollier chart, enthalpy h is plotted in the vertical axis and the entropy s is plotted on the horizontal axis. The h-s diagram is widely used to analyse the steam turbine as the illustrated enthalpy directly represents the turbine work and heat transfer.
The h-s diagram also contains constant pressure, constant temperature and steam quality lines which allows the engineers to determine the steam properties with minimal use of the steam table. When the steam is expanded in the steam turbine, the work output is estimated from the enthalpy drop.
The isentropic efficiency of the steam turbine is calculated as
Where h2a is the actual turbine exit enthalpy and h2s is the isentropic exit enthalpy of the turbine. These features makes the h-s diagram an indispensable tool for evaluation of turbine performance and power plant cycles.
How to read the h-s diagram
Locate the inlet steam condition: Identify the turbine inlet pressure and temperature on the h-s diagram. The corresponding point gives the enthalpy h1 and entropy s1 on the vertical and horizontal axes respectively.
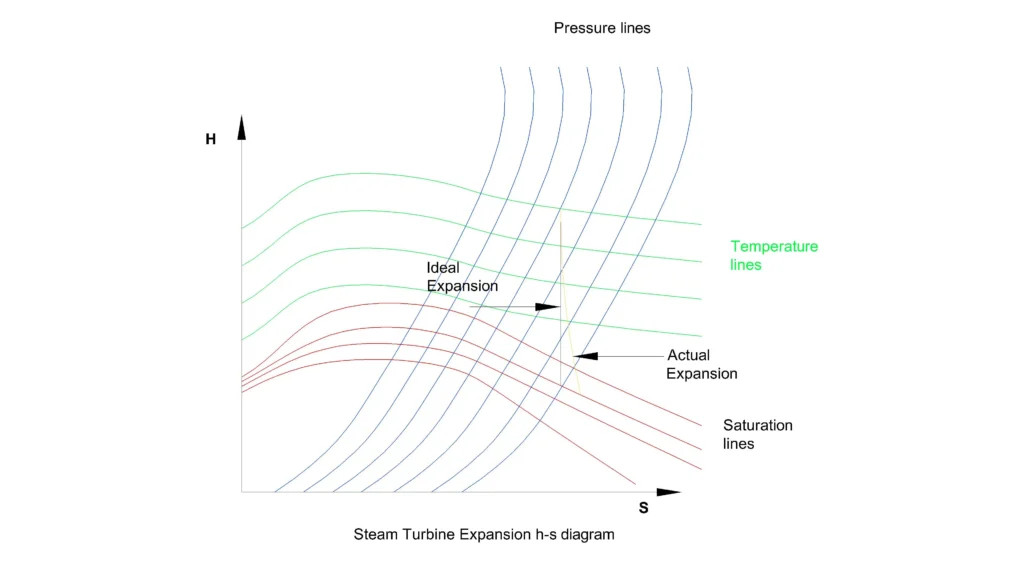
Follow the ideal isentropic expansion: A vertical line drawn downwards with constant entropy until it intersects the turbine’s exit pressure line. This point will give the enthalpy of the ideal exit state h2s.
Locate the actual expansion: Due to irreversibilities, the actual expansion shifts towards the right, indicating an increase in entropy. The actual exit state of the turbine will have an enthalpy h2a and entropy s2a.
Now if we know the turbine’s isentropic efficiency, we can locate the actual expansion by calculating the actual exit enthalpy.
Actual turbine work
Ideal turbine work
Isentropic efficiency
Rearranging,
Thus, by tracing the actual exit enthalpy h2a on the h-s diagram we can find the exit parameters of the turbine line pressure, temperature, seam quality, moisture content etc.
This article is a part of thermal system, where other related articles are discussed.