In general, the electrical resistance of a material changes with the change in temperature. The effect of temperature on resistance varies according to the type of material as discussed below
Table of Contents
EFFECT OF TEMPERATURE ON RESISTANCE OF PURE METALS
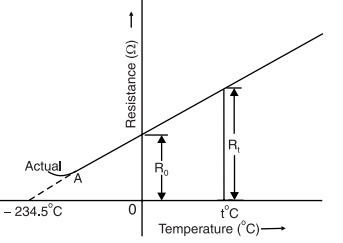
The effect of temperature on resistance is such that the resistance of pure metals (e.g. copper, aluminum) increases with the increase of temperature. The change in resistance is fairly regular for a normal range of temperatures so the temperature on resistance graph is a straight line as shown in Fig, it shows the temperature/resistance graph for copper which is a straight line. If this line is extended backward, it would cut the temperature axis at −234.5°C. Theoretically, there is no resistance of the copper wire or the resistance is zero at −234.5°C. However, in normal practice, the curve bends away from the straight line (point A) at significantly low temperatures.

Since the resistance of metals increases with the rise in temperature, they have a positive temperature coefficient of resistance.
EFFECT OF TEMPERATURE ON RESISTANCE OF INSULATORS
The resistance of electrolytes, insulators (glass, mica, rubber, etc.), and semiconductors (germanium, silicon, etc.) trends down as the temperature rises. Hence these materials are known to show a negative temperature coefficient of resistance.
EFFECT OF TEMPERATURE ON RESISTANCE OF ALLOYS
However, the effect of temperature on resistance in the case of alloys is such, that the resistance of alloys increases with the rise in temperature but this increase is very small and irregular. For some high-resistance alloys (e.g. Eureka, manganin, constantan, etc.), the effect in resistance over a wide temperature range is practically ignored.
Temperature Coefficient of Resistance
Let us consider the resistances, R0 at 0°C and Rt at t°C. It has been found that in the normal range of temperatures, the increase in the resistance (i.e. Rt − R0) is directly proportional to the initial resistance i.e. Rt − R0 ∝ R0
The increase in resistance is directly proportional to the rise in temperature i.e.
Rt − R0 ∝ t
The effect of temperature on resistance also depends upon the nature of the built-up material.
Therefore, by combining the first two, we get,
Rt − R0 ∝ R0 * t
or Rt − R0 = α0 * R0 * t, where α0 is the temperature coefficient of resistance at 0°C.
Rearranging the above equation we get,
Rt = R0 (1 + α0 t)

= Increase in resistance/ohm original resistance/°C rise in temperature.
Hence, the temperature coefficient of resistance of a conductor is the increase in resistance per ohm original resistance per °C rise in temperature.
The unit of α is ohm/ohm°C i.e./°C. Also, the temperature coefficient of resistance for copper is 0.00426/°C. It means that if a copper wire has a resistance of 1 Ω at 0°C, then it will increase by 0.00426 Ω for a 1°C rise in temperature i.e. it will become 1.00426 Ω at 1°C. Similarly, if the temperature is raised to 10°C, the resistance becomes 1 + 10 × 0.00426 = 1.0426 ohms.
Important points to be noted:
Those substances (e.g. pure metals) whose resistance increases with rise in temperature are said to have a positive temperature coefficient of resistance. On the other hand, those substances whose resistance decreases with an increase in temperature are said to have a negative temperature coefficient of resistance.
If a conductor has the resistances as R0 at 0o C, R1 at t1o C, and R2 at t2o C, then,
R1 = R0 (1 + α0 t1),
and R2 = R0 (1 + α0 t2)

This relation is often utilized in determining the rise of the temperature of the winding of an electrical machine. The resistance in the winding is checked at the beginning and end of the test run. Let R1 and t1 be the resistance and temperature respectively at the commencement of the test. After the significant operation, let the final values of the resistance and temperature be R2 and t2. Since R1 and R2 can be measured and t1 (ambient temperature) and a0 are known, the value of t2 can be calculated from the above equation. The average temperature rise in the winding will therefore be (t2 − t1) ° C.
The life expectancy of an electrical device is limited by the temperature of its insulation, the higher the temperature, the shorter the life. The useful life of the electrical apparatus decreases by half approximately every time the temperature increases by 10°C. This means that if a motor has a normal life expectancy of eight years at a temperature of 100°C, it will have a life expectancy of only four years at a temperature of 110°C, two years at a temperature of 120°C and only one year at 130°C.
Graphical Determination of Thermal Coefficient of resistance,α
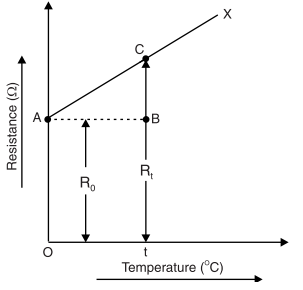
The value of the temperature coefficient of resistance can also be determined graphically from the temperature-resistance graph of the material. Fig. below shows the temperature/resistance graph for a conductor.

AX is a straight line in the plot between resistance and temperature as it is with all the conductors. In the above plot, the resistance of the conductor is R0 represented by the line OA at 0°C and the resistance increases to become Rt at t°C.
But Rt − R0 = BC
and t = rise in temperature = AB and α0 = BC / (R0 * AB)
But, BC/AB is the slope of the temperature-resistance graph. Therefore, α0 = Slope of the graph / original resistance.
Hence, the temperature coefficient of resistance of a conductor at 0°C is the slope of the temperature-resistance graph divided by resistance at 0°C (i.e. R0).
Important points to be noted:
The value of α depends upon temperature. At any temperature, the value of α can be calculated by using
α0 = Slope of the graph / original resistance (R0) and
αt = Slope of the graph / original resistance (Rt).
The value of α0 is the maximum and it decreases with the rise in temperature. This is clear from the fact that the slope of the temperature on the resistance graph is constant and R0 has the minimum value.
FAQ’s
What is a positive temperature coefficient?
It is a property of a material where the electrical resistance of a material increases with the rise in temperature. Conductors like copper and aluminum are good examples of materials with PTC properties. It reflects effect of temperature on resistance of conductors.
What is a negative temperature coefficient?
It is a property of a material where the electrical resistance of a material decreases with the rise in temperature. Insulators like glass and porcelain are good examples of materials with NTC properties.
This article is a part of the Cables and Conductors, where other articles related to the topic are discussed in details.

